


We had an extreme drought in the northeastern region of the United States over the summer of this year. There is drought in the west coast and high plain region almost every year, however, drought in the Northeastern region is not common. When I write ‘drought’ in this blog, it is meteorological drought meaning less rainfall than average. In this blog, I discuss the 2020 drought on a regional scale and confine my analysis to Rhode Island, where I live now. It is not easy to visualize drought in a real world, so I’m trying to visualize using graphs and maps.
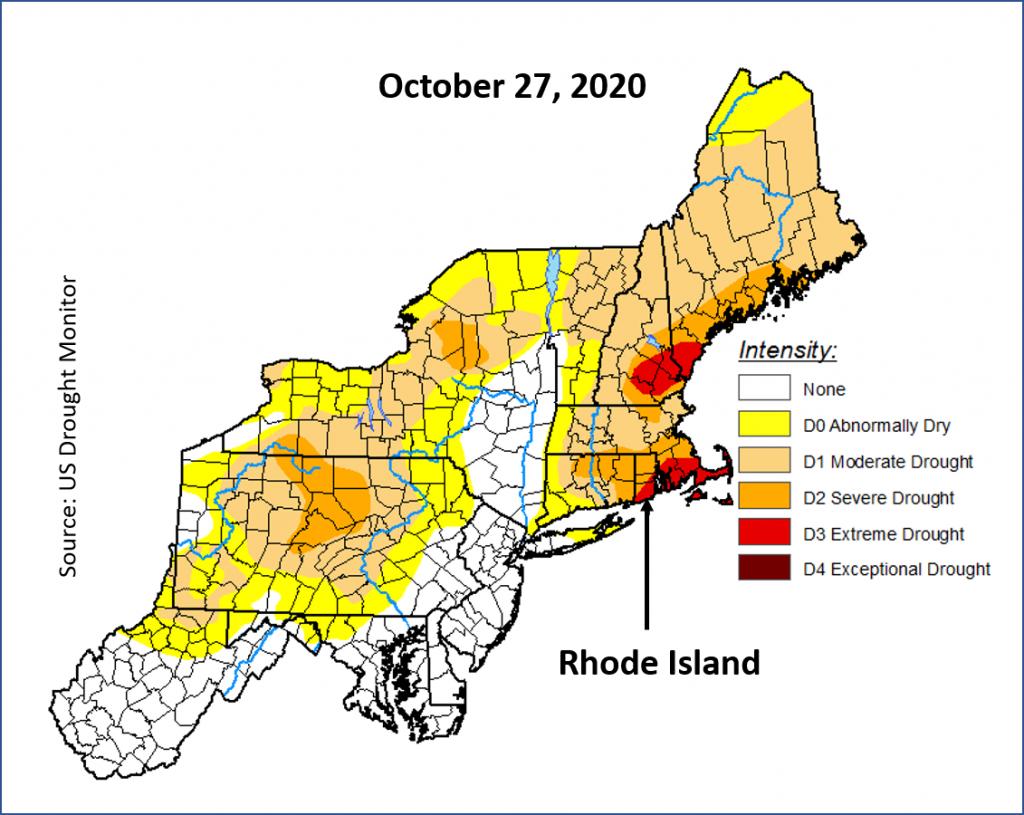
The US Drought Monitoring Center categorizes drought in scale D0 (abnormally dry) to D4 (exceptional drought). In the map below (Oct 27, 2020), we can see that some part of the northeastern region was under D3 (extreme drought) condition, and the drought persisted in the region until the first week of November. D3 is the condition of ‘widespread water shortages’ and D2 is water restrictions. For Rhode Island, the US Drought monitor defines the D3 category “Extremely reduced flow to ceased flow of water is observed; river temperatures are warm; wells are running dry; people are digging more and deeper wells”. Over the summer, watering lawns were restricted by many towns in Rhode Island. Everyone knows about this extreme drought in the region, but I want to show what the numbers say. This is the main motivation for writing this blog.
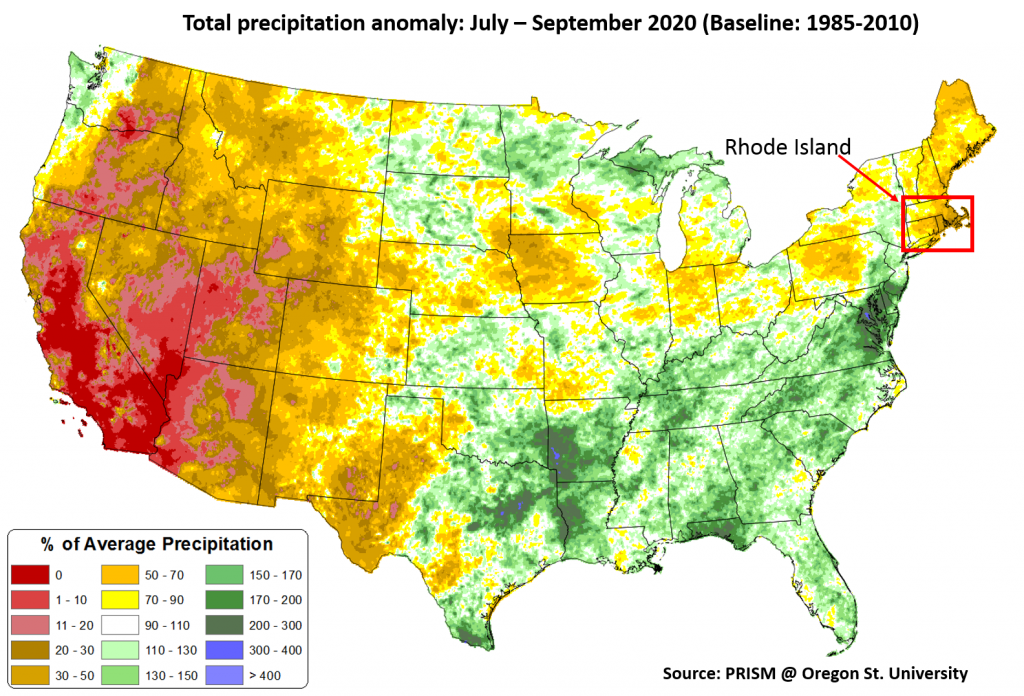
The 2020 CONUS precipitation map shows that there was only 30-40% of the average rainfall for the period July through September. It’s interesting to note that in summer months in the northeastern region, the evapotranspiration (meaning the water eaten up by plants) exceeds the precipitation in an average year, and in a drought year, the difference is even wider.
Drought affects every sector including ecosystem, agriculture, water resources, and then ultimately the economy and shortage of Christmas trees. NOAA writes that drought and its impacts are two parts of a coin, we need to understand the impact of drought to fully understand a drought. Below are some of the tweets earlier this year about the impacts of the drought.
2020 also killed this year’s crop of Christmas trees. https://t.co/05N4yNmJj6 pic.twitter.com/UKcwujSkLg
— ecoRI News (@ecoRInews) November 19, 2020
Current state of the @universityofri pond and my #floatingwetlands.
— Dr. Soni M Pradhanang, Ph.D. (@H2O_Soni) September 22, 2020
The pond is bone dry. We need #rain.#drought is not helping these floats. They are not floating 🙃@URI_GEO @uricels #PradhanangLab #WaterWhisperer #phytoremediation #waterquality #CleanUp #stormwater pic.twitter.com/Hl9otJ2nE6
Since I’m a student of hydrology, so I see drought through the lens of water and it’s interesting to analyze the impact of this widespread drought on water quantity and quality. Rhode Island is a small state in the southern part of the northeastern (also called New England) region. The precipitation pattern in Rhode Island does not show any significant seasonality, meaning every month one can expect an average precipitation amount. However, in winter due to the ambient temperature, the form of precipitation changes i. e. from rain to snow.
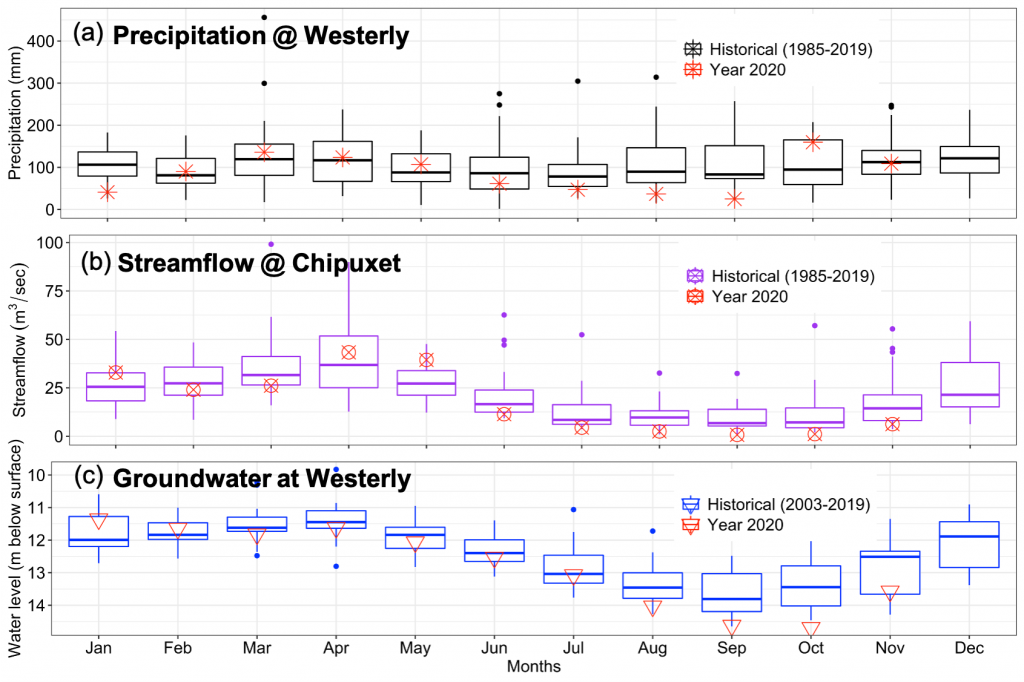
The boxplot below depicts that the precipitation amount in the year 2020 in the summer months (June through September) was below the 25-percentile of the historical record. The rainfall occurred from July through September in Rhode Island in 2020 was only 30-40% of the historical record. The reduction in precipitation is clearly shown in streamflow in the summer months. In some of the months such as August, September, and November, the stream discharge was record low. Similarly, since the aquifer in Rhode Island is shallow and very sensitive to the annual groundwater recharge, it responds to drought. In the 2020 drought, the groundwater level in an observation well at Westerly was record low for the month of October and less than 25- percentile of the historical record throughout the summer months. Because of the evapotranspiration effect in summer, the streamflow and consequently, the groundwater level is at the low level.
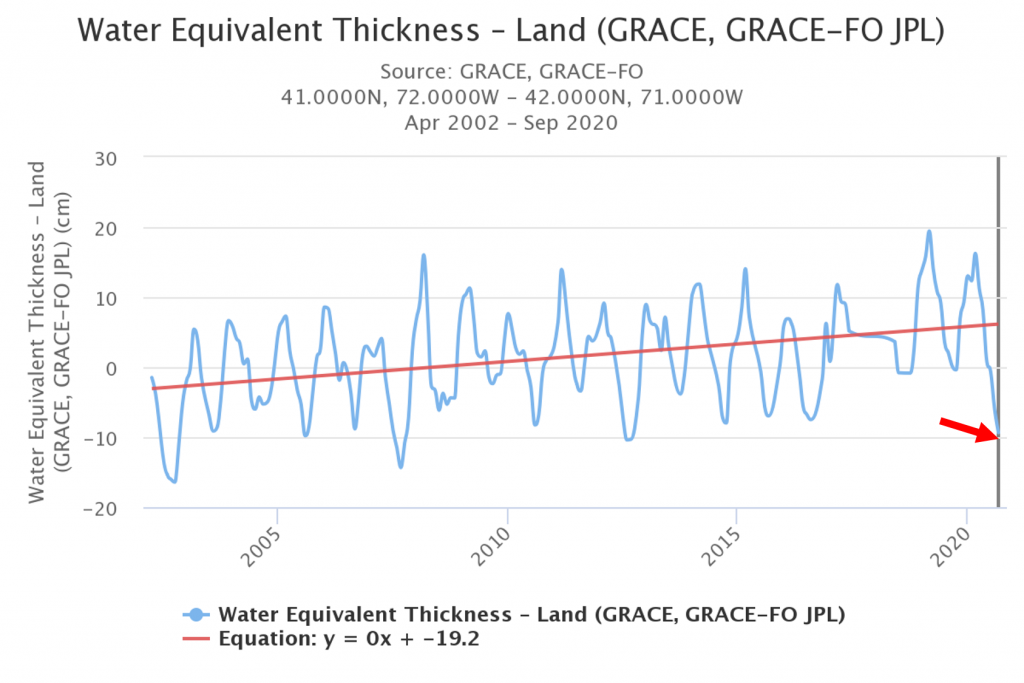
The GRACE satellite data (see the graph below) shows a big drop in total water storage in the Little Compton area. They have not processed the data for November and December of this year yet. Please note the satellite data can be used as a proxy for groundwater level. Several studies have found that the main contributor to the change in total water storage anomaly is groundwater. However, nothing can beat the ground-based measurements.
From the map below, in general, the total dissolved solids (TDS) of well water from shallow aquifer throughout Little Compton in Rhode Island is higher for 2020 summer than 2019 summer. Rainfall and consequent recharge dilute the groundwater, but because of the drought in the summer of 2020, there was very little groundwater recharge. It is not justifiable to conclude only with the two years of data; however, it is plausible that the shallow well’s conductivity goes up in widespread drought time. There is a big change in the well water conductivity in the south-western part of the town, it could potentially be due to seawater intrusion into the well because, in the summer month, the hydrostatic gradient between fresh groundwater and salty seawater is ‘disturbed’. This creates an enabling environment for groundwater contamination by seawater. There are some health implications of drinking saltwater such as hypertension, but do not worry, you can absolutely cook pastas with the saltwater contaminated water.
It will be interesting to analyze whether the groundwater level and the conductivity bounces back to the original position over the winter and spring season. I will write another blog with some more information next year summer.
Use the slider on the map below to visualize the change. Data: LC town